
What is the income statement?
The income statement, or the profit and loss statement, makes up one of the three main financial statements, the others include the balance sheet and the cash flow statement. It shows the earnings and costs of a company in any single fiscal year, basically indicating how well they get on.
Being one of the most important things you’ll look at when deciding which stock to purchase, we’ll run you through which parts to pay close attention to and the equations to arm yourself with. It’s also worth noting that the income statement should always be analysed in conjunction with previous years figures to give a more complete picture of what’s being observed.
Before going any further here’s a refresher on the main items of the income statement.
Breakdown of the different parts?
Revenue – Total amount of income generated from the sale of goods and services
Cost of Sales – Total of all costs used to create a product or service
Gross Profit – Revenue – Cost of Sales
Operating expenses – Expenses incurred through normal business operations
Research and Development – Expenses incurred through the businesses innovation of products and processes
Selling General and Administrative – Selling expenses and all general and administrative expenses
Non recurring – An extraordinary one-time expense or sale
Other – Expenses not related to a company’s main business
Operating Profit/EBIT – A profit from business operations, gross profit – operating expenses before interest and tax
Net Income – A company’s final profit

Summary of the different formulas
There are many formulas used to analyse the income statement, some of the most famous include: Gross Profit Margin, Operating Profit Margin, P/E, Schiller P/E, PEG, EPS and ROE to name a few. Over the course of this post we’ll analyse the gross and operating profit margin, P/E ratio, EPS and PEG.
Gross Profit Margin
The gross profit margin is derived from the formula (gross profit/revenue)*100. This gives you the percentage of revenue that actually becomes gross profit. This is important because it shows how close a company is to covering their costs from sales. The gross profit margin also acts as a starting point before leading to operating profit and net income, if the margin is good it puts final profits in a far better position.
By itself the gross profit margin isn’t super useful, it needs to be in tandem with industry averages, the companies main competitors and pricing strategy (premium vs cost-effective). When comparing this margin you’ll be able to see how the business measures up, a high margin and the ability to make a lot of sales indicates the company has done well, whereas a low margin compared to their closest competitors does not bode good news.
Operating Profit Margin
Another profitability ratio, you get the operating profit margin from the formula (operating profit/revenue)*100. This is the profit after cost of sales and operating costs but before interest and tax. The operating profit margin gives a solid indication of how effectively the companies management is at keeping costs to a minimum. The company normally has more control over its operating profit margin than its gross profit margin counterpart, so is a better ratio for analysing the performance of management.
Similarly to the gross profit margin, this should be compared to industry averages and competitors margins to give a more complete picture. As before the higher the margin the better, when profit margin is low, share price often is too.
P/E Ratio
The P/E (price to earnings) ratio is calculated from share price/earnings per share. Used as a quick gauge to see how expensive a stock is relative to its earnings, it’s one of the most famous and easy to use tools. In bear markets you’ll see the average P/E lower than in bull markets where they will be higher, also acting as a tool for total market undervaluation or overvaluation, as shown here.
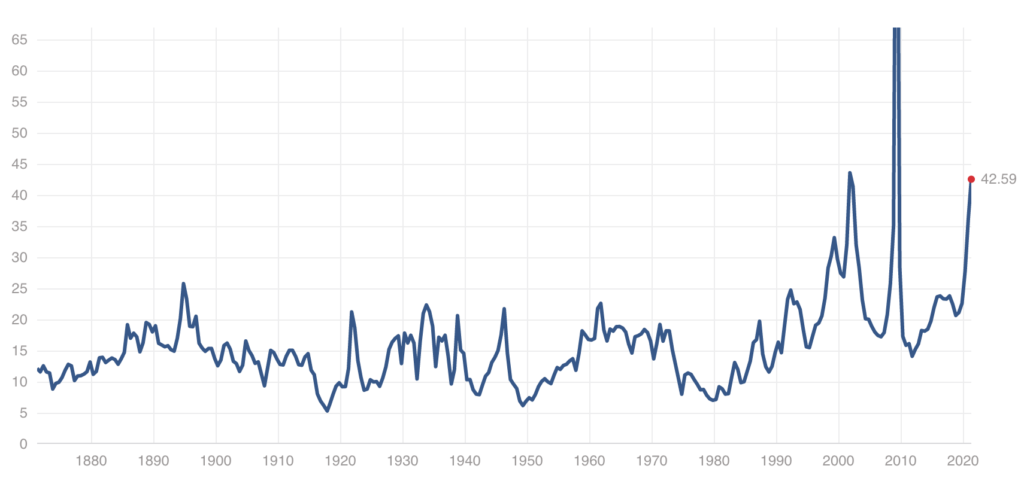
Benjamin Graham, the father of value investing, didn’t like companies with a P/E of over 20, but modern day investors know that it doesn’t always have to be below that figure. Technology companies often have a P/E of over 50 or 100, it doesn’t necessarily mean they are overvalued, just that further calculations are required on their earnings and growth rate to see if their P/E ratio is justified. The current average of the S&P 500 as of this post rests around 36, but in the past has averaged about 16.
When considering purchasing stock in a company, the P/E ratio should also be compared to other competitors and what the average P/E of that sector is. The source of income and unusual elements in the balance sheet should also be considered to give a more complete picture.
PEG Ratio
Developed by the great investor Peter Lynch, who over his 13 years at Fidelity achieved a staggering 29.2% annualised return, the PEG ratio is an adaption of the PE ratio that integrates growth into the formula.
The formula is PEG = P/E ratio / company’s earnings growth rate
By combining the projected growth rate with the P/E ratio, you’re able to compare companies of similar P/E ratios but gain a more complete understanding of the value you’re getting when buying that stock. A result, 1 would mean a perfect correlation between the company’s market value and projected growth, with stocks over 1 being overvalued compared to its growth rate and stocks under 1 being undervalued.
Although this is an oversimplification, due to a range of other factors making an undervalued company. At first glance it allows you to compare companies in similar sectors to see whether one looks more like a bargain. Eg a company with a PEG of 0.85 vs 1.6.
Growth rate and EPS
One of the most important factors affecting the company’s stock price is the growth rate. If earnings have been consistently growing, then the stock price most likely has too. Although each industry is unique, you’d ideally like to see sales growth of 5% to 7% a year at least over a 10 year time span.
EPS = (Net Income – Preferred Dividends) / Weighted Average Shares Outstanding
Defined by Ben Graham, stable earnings mean they have doubled in the most recent 10 years and earnings declined by no more than 5% no more than twice in the past 10 years. Obviously recessions happen and each sector has its business cycles, but if you’re able to find a company with good earnings during a downturn in its cycle then you’ve done well.
Another important formula, earnings-per-share (EPS) indicates how much the company has earned for each share of its stock. The higher the EPS the better and consistent years of declining EPS does not spell good news. The EPS should be rising, with another metric of stability also being assessed by the trend of per-share earnings over a ten-year period. A decade of a rising EPS shown to be good for the company and its stock price.

Excessive write-offs
An important issue often displayed in income statements are the excessive write offs. They can either be a gain from the sale of a headquarters or catastrophic event that caused the company to lose millions, these one time events distort the income statement and don’t accurately reflect the companies fair earnings. When your analyzing the earnings of a company you should lift the writeoffs from the statement, as to create a better picture that isn’t abnormal profits.
R&D spending
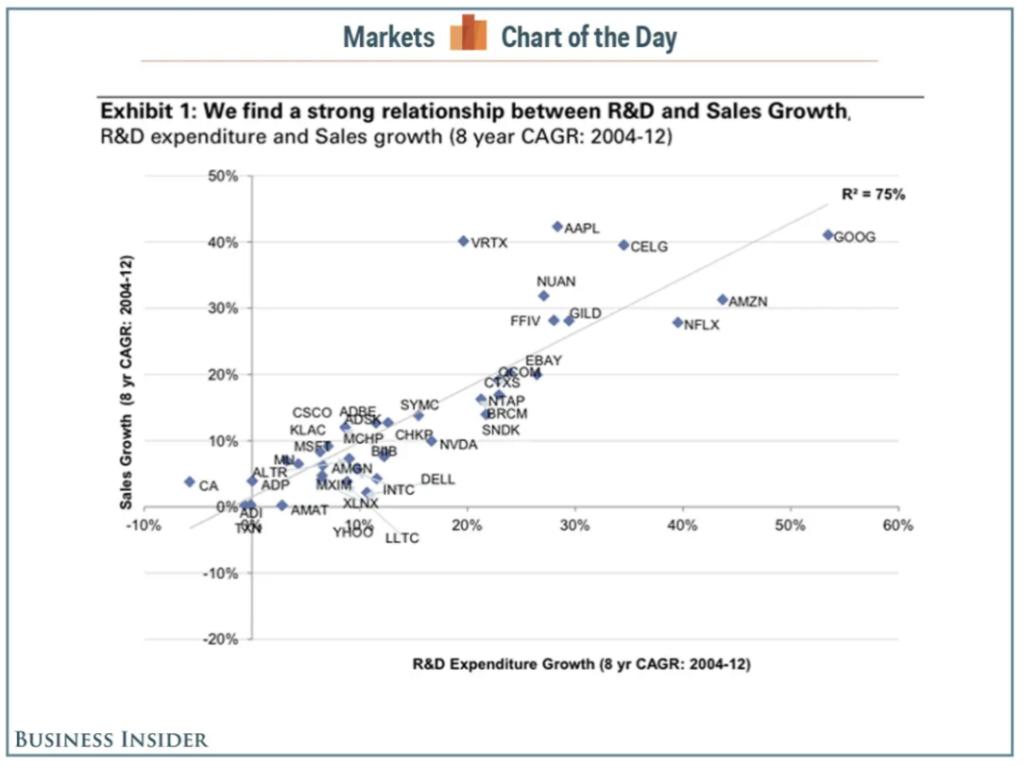
Another thing to watch out for is that the company is spending on research and development. You’d think that adding to another expense isn’t cost effective, however there’s a reason why R&D and sales growth have a positive correlation. If the company is spending on new innovative ideas chances are you’ll eventually see the promise of these ideas if the company has a good track record. Many of the world’s most valuable companies also spend the most on getting ahead of the curve.
If you’ve looked through the rest of the income statement and the fundamentals are there and you see them out spending their competitors, either as a percentage of their revenue (R&D/Revenue) * 100 or just as a total, its a good sign.
However, it’s important to note varying industries will spend different amounts, for example Coca Cola would spend far less than say Intel. Furthermore, some companies are smart enough to buy pre-existing technology either from other companies or the government to keep R&D costs low and advance their position in the market, eg Apple.
Summary
Over the course of this article, we’ve tried to show you where some of the fundamental items and ratios to look at are when analysing the income statement. The income statement can often be misleading and finding the true value of the items on the statement isn’t always easy. Hopefully after reading this though you have a better idea of some of the more important factors to consider, however this only improves through looking at company reports yourself.
Everything mentioned here doesn’t explain the whole statement’s intricacies (that would be a much.. much longer article). But it does give an introduction of what to consider before purchasing a stock, the list below are some of our favourite books that helped us with understanding them.
Other useful resources:
Related article: How to buy a stock
Related video: Profit and Loss Statement Explained
One reply on “What to look for in the income statement?”
Just read this article, very interesting and detailed. Learnt a lot from this, definitely worth a read