
When thinking about stocks, people often try to find the optimal time to invest in the market to maximize returns. The idea can be confusing, especially with experts referring to a plethora of different factors that lead in different directions.
That’s why we’ve compiled 3 ratios for you that have time and time again shown a strong correlation with the general value of stocks, showing you if the market is overpriced or underpriced? The factors that we’ll be discussing are as follows: Market cap to GDP, P/E ratio and the Shiller P/E ratio.
Market Cap to GDP
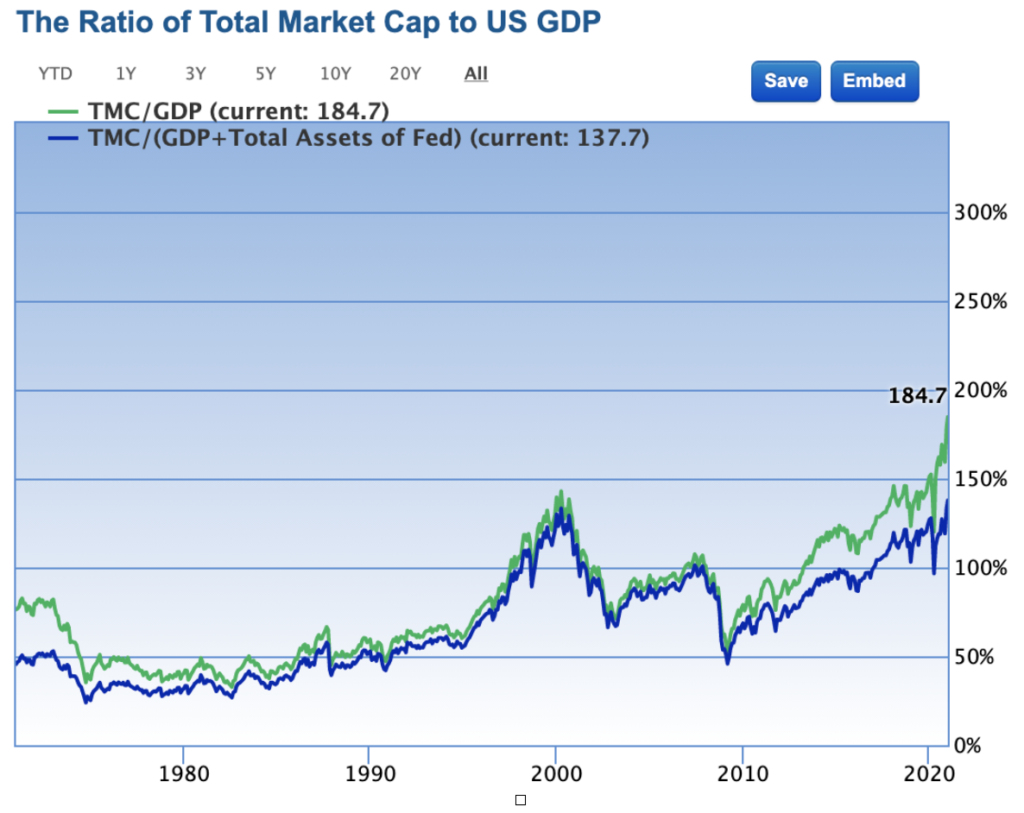
Warren Buffett’s favourite indicator and often referred to as the ‘buffett indicator’, the market cap to GDP formula is used to show the correlation between the market capitalisation of a countries stock market to its GDP, by dividing market cap by GDP you’ll get a number (or percentage), that will give you the information you need to see the markets current valuation. The table below outlines the ratio at different valuation levels so you can see how the current market matches up.
| Market Cap/GDP | Valuation |
| X ≤ 74% | Significantly Undervalued |
| 74%﹤X ≤ 94% | Modestly Undervalued |
| 94%﹤X ≤ 114% | Fairly Valued |
| 114%﹤X ≤ 134% | Modestly Overvalued |
| 134%﹤ X | Significantly Overvalued |
As of today, 24th December 2020, the current Total Market Cap to US GDP ratio is 184.7%. Indicating a significantly overvalued US stock market. Which is to be expected after the longest bull run in US stock market history, over 11 years and counting. Although the graph below does not show perfect correlation with every recession, it’s pretty good at it. Indicating when stocks might be a bit more pricey.
P/E Ratio
Another important ratio when looking at the current valuation of the stock market. The P/E ratio is typically used as a quick indicator to look at the current cost of individual stocks, by dividing the share price by earnings per share. But when done across the whole stock market it also tells you how the market measures up. For example in the US, if you take the S&P 500, the historical average has been 15.87. However as of today 24/12/20, the current average is 37.3. This figure is double the average from the past, showing a general overvaluation of the market when compared to historical data.

Shiller P/E Ratio
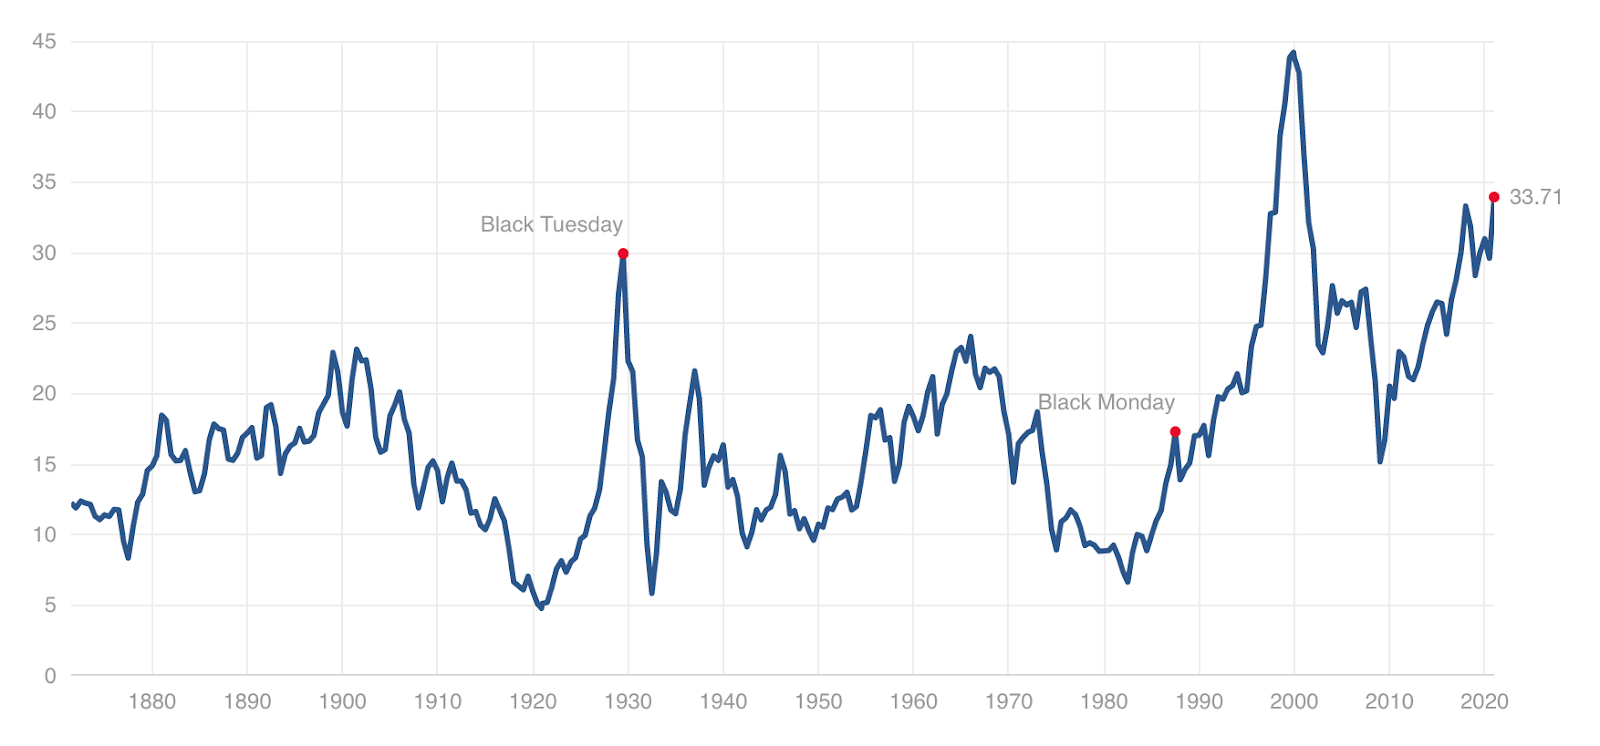
Created by Professor Robert Shiller of Yale University, the Shiller P/E ratio, or the CAPE (cyclically adjusted price-to-earnings) ratio measures the valuation of a stock or stock market similar to the P/E ratio previously discussed. However, unlike the PE ratio it accounts for average earnings over the previous 10 years adjusted for inflation. By taking the average earnings, fluctuations in the business cycle are smoothed out.
The ratio is often used to find if the market is overvalued or undervalued by comparing it to its historical average, if taking the last 20 years that would be 25.6 and today’s rest at 33.71, indicating an overvalued market. The ratio is touted for its ability to pick up on potential bubbles, as the graph below particular high points have seen crashes following it. In addition to its ability to pick up on market valuation, it’s also used to forecast potential stock market returns. A higher than average ratio indicates that the market will produce lower than normal returns, whilst a lower than average ratio predicts that returns will be higher.
Summary
When looking at the current market conditions indicated by these ratios, the outlook of buying stocks might sound bleak at best. But always remember that these are just overviews and are inherently backwards facing, you need to look ahead because no one can predict the stock market, just react to it. Although good generalisations of where the stock market is at, it’s imperative to keep your eyes peeled because bargains can ALWAYS be found for those who spend the time looking.
These ratios will serve you well when looking at current market conditions, from there you can see if there will be more discounts or have to be pickier when selecting stocks. But they should never hinder you from looking through stocks to buy, it’s important to note that time in the market has generally served people better than attempting to time the market.